

🌟 New Year Offer 🌟
Celebrate 2026 with 30% OFF on all products! Use code: NEWYEAR2026. Hurry, offer ends soon!
Master advanced swing trading with “Selene’s Chariot” – a breakthrough system that uses celestial mechanics to predict trend slopes and price targets with uncanny precision.
Unlock professional-grade tools used by fund managers to identify market turns and capture high-probability trades across any time frame!
Sean Erikson – Trading with Selene’s Chariot
Trading with Selene’s Chariott
An Introduction to Sean Erikson’s Course


Intent of This Course
Conclusion
In my 35 years in this field, I have never seen anybody use or even hint at this tool before. Dr. Jerome Baumring was the only other person who did any real work on determining the slope of the trend, and he used to discuss the “angle of attack”, but he never demonstrated familiarity with this technique. One might think that this could be one of Gann’s undisclosed tools, but there is no confirmation that Gann knew this specific technique himself. It’s possible, and his hints sure could be pointing at it, but there is no evidence for it. So, Sean Erikson is the only one we can credit with this brilliant discovery! And BIG credit to Sean for finding it, and even more so for sharing it with us!
When we are brought such breakthrough insights and proprietary trading tools, we always wonder how to price them. Generally, we price according to the overall value of the work based upon its originality, depth and applicability as our key factors. This work receives the highest marks in each of these categories! If this were an original Gann document of as little as 5-10 pages that included this slope determination technique alone, without any of the other tools that Erikson developed over two decades to fine tune it to trading, it would easily go for a price tag of $10,000 a copy or more, for just a dozen pages or less. So, there is no question that this course developed to its most complete refinement and application justifies our highest price tag, but we really don’t want to make it out of reach, so we’re going to list it at $7500.
Important Tools & Elements of the Book
I am not going to present another overview of the tools since the author already did an excellent job of that in his overview. Instead I will try to describe some of the elements about the tools and concepts that are not clear without reading the book in an attempt to anticipate questions that readers might have. If I have fallen short, the Frequently Asked Questions should fill in anything I missed. The tools themselves are actually quite simple to understand and apply. There are no particularly complex calculations and for the most part they can be generally understood in 20 minutes. They are exactly what Erikson shows in his Overview and again in his market examples.
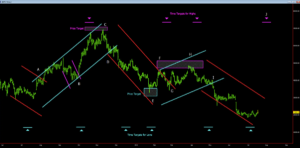
The book pulls examples from the S&P, Oil, Gold, Forex, and some stocks, using time frames as short as 2 minutes and as long as a Weekly chart, but it makes absolutely no difference at all in terms of the function or application of the tools. A chart is a chart is a chart, what the time scale is across the bottom or the name on the top does not matter with this technique, as long as you have followed the rules of Chart Squaring as explained in the book. You could black out the time lines so you didn’t know if it was weekly or minute chart, and the tools will work and look exactly the same. That is why this system works for either longer-term trend trading or short-term daytrading. This is a truly universal toolset for advance determination of the trend-angle, including its range of price fluctuations on any scale.

The main astronomical tool that projects the trend is quite easy to apply and can be done by hand in a minute. This will likely blow your mind because it really catches the trend pretty much every time. There are a few different possible scenarios that it indicates, like with Gann angles, and it will run right up or down one of them, which is generally clear from the outset when you set the channel.
Determining the channel width is not particularly complex either. One can either use a rather common technical indicator defined by market action to set the initial measure of the width (like Gann’s yardstick), or if you prefer to set your channel even earlier, Erikson has developed a simpler method to calculate the channel width as soon as the turn has been determined. It’s a bit more work to do it, but this way you don’t have to potentially miss trading the 1st move. The accuracy of the faster technique usually provides a very close estimation of the true width confirmed by the slower tool. Once the initial move completes, you can adjust the channel if it is not accurate enough already.
The two methods of placing of the channel lines come into play in two different cases. The first can be applied as soon as the top or bottom turning point has been identified, even before the channel is broken. The other uses more standard technicals to set the new channel soon after the old is broken. Erikson characterizes the options as,
“there’s an easy way and a hard way to do this, and they tend to give very similar results. The benefit of the hard way is that you get the channel width early, at the turning point. The downside is that it’s a bit more work…”
All the other tools are then set according to the geometry of the swings and the astro element which determines the slope to begin with, so they are all quite neat and tidy and mathematically related. The only real variation is found when market volatility either suddenly expands or contracts significantly in price range compared to the prior swing, so that the lines are either way to wide or way too narrow to usefully contain the succeeding move. In such cases there is a simple method to adjust the geometry to provide more appropriate guidelines, just like one can do with Pitchforks or ML lines, however without the dynamic element they have where you can constantly add another line or make another division, which becomes confusing and quickly generates too much information to be useful.
Not so in Selene’s Chariot! These lines are preset and fixed according to a single mathematical principle, so they are clear and do not move around or have multiple options. This is what makes them more powerful and useful than those we are all used to. It’s all pure engineering developed from scientific principles, very logical with no subjectivity whatsoever! A group of people using the tools on the same market will find the same slopes, channels and geometry. It is not like Elliot wave with subjective judgements and multiple count variations that different people will define differently, making it confusing and hard to trade. This work is crystal clear and providing absolute parameters that are not questionable.
Another intelligent approach of Erikson’s trading methodology is that he uses multiple hierarchical time frames for the analysis, risk management, entry and exit triggers. For instance, if he’s trading the trend in the Daily timeframe, he is tracking at least 2 or 3 smaller intraday levels to generate early signals for his entries, stops, exits and general trading strategy. This is one way that he increases the risk/reward ratio, because the reward is governed by the higher timeframe, daily say, while the risk is determined on the intraday scale, say hourly.
The same could be done similarly on weekly/daily scales for a longer term trader who wants to trade the intermediate term trends (weekly) but generate his signals on the daily level to have tighter risk parameters. Or for the day trader, if you’re trading on an hourly level, you will be watching the trends of several levels below that to seek convergences of signals at the earliest possible points. It’s all quite logical, clear and intelligent, and relatively easy to apply, particularly if you have the software!
The author sweetens the core technique by developing a set of rules to guide traders in following the channel swings. He then tops it off with another surprisingly simple astronomical tool for timing the next turn or two out that is so simple and effective it will surprise you. The last geometrical tool provides the projections of the two most likely price termination points using a little ancient geometry and is as simple as can be. That’s it! There are some further details and subtleties beyond these generalizations, but these tools are conceptually straight forward and technically easy to apply.
Astronomy vs Astrology
We would like to provide a clarification at the outset as to some of the terms we use like “celestial mechanics” and “astro-technique”. This work is actually NOT based upon financial astrology, which many professionals avoid. This technique is based upon simple relationships of celestial motion relating to the Sun, Moon and other bodies in our solar system and their influence upon us directly and through the Sun.
There are NO horoscopes to be drawn, NO birthdates required for markets, and NO analysis and comparison of planets and signs and their relationships in ANY way. That is what we mean by saying that this technique is based upon pure astronomy, though the author may refer to it as “astrology” here and there, which is the common lingo in the field AstroEconomics, but the term is not fully actually accurate for these tools. All the tools developed and used in this course are based upon what Baumring would call Numerical Astrophysics, or what we call Cosmological Economics. Nowadays, even the Federal Reserve discusses the relationship of sunspots to financial cycles, so such ideas are becoming more mainstream, and those who have advanced knowledge of such technology have a significant edge over the competition who sees nothing where we see order.
There is nothing metaphysical about this work whatsoever! It uses mathematical, geometrical and astronomical calculations in price, time and price/time, and requires no prior knowledge of astronomy, astrology or even geometry. All is explained clearly enough for even a beginner to understand, and the author will monitor an Online Research Forum where course owners can ask questions and discuss market setups and the proper placement and application of the tools for trading.
Online Student Research & Trading Forum
The author has agreed to monitor an Online Research & Trading Forum for this course. The Forum will be the equivalent of a classroom where the author will help readers to clarify and apply the analytical and trading techniques presented in the course. We want to assure that no detail is left out and that the material is fully comprehensible and applicable by everybody, so we feel it is important for students to have access to the author to clarify any issues or answer any questions they may have. It will also be a place where readers can discuss their analysis of the markets or engage in expanded research upon deeper theoretical topics in the book. Sean and I have already been discussing some new areas of research that his work leads directly into that he was unaware of, and which we agreed we would explore further in the forum.
Software Which will Produce the Tools in The Book
The author is a long time user of Online Research Forum software and had included with the book a number of programming scripts which will reproduce the tools used in the book and allow them to be applied directly on the charts with the click of a button.
These tools are so useful that we have arranged with Wave59 to provide a special deal for owners of Erikson’s book.
Wave59 can be subscribed to for the very reasonable cost of $100 a month, and there are no further costs to use Erikson’s scripts from the book. We are further finalizing some extra special deals with Wave59 for ICE customers, so please inquire directly and we will provide you with full information.
Course Features
- Lecture 0
- Quiz 0
- Duration 10 weeks
- Skill level All levels
- Language English
- Students 59
- Assessments Yes